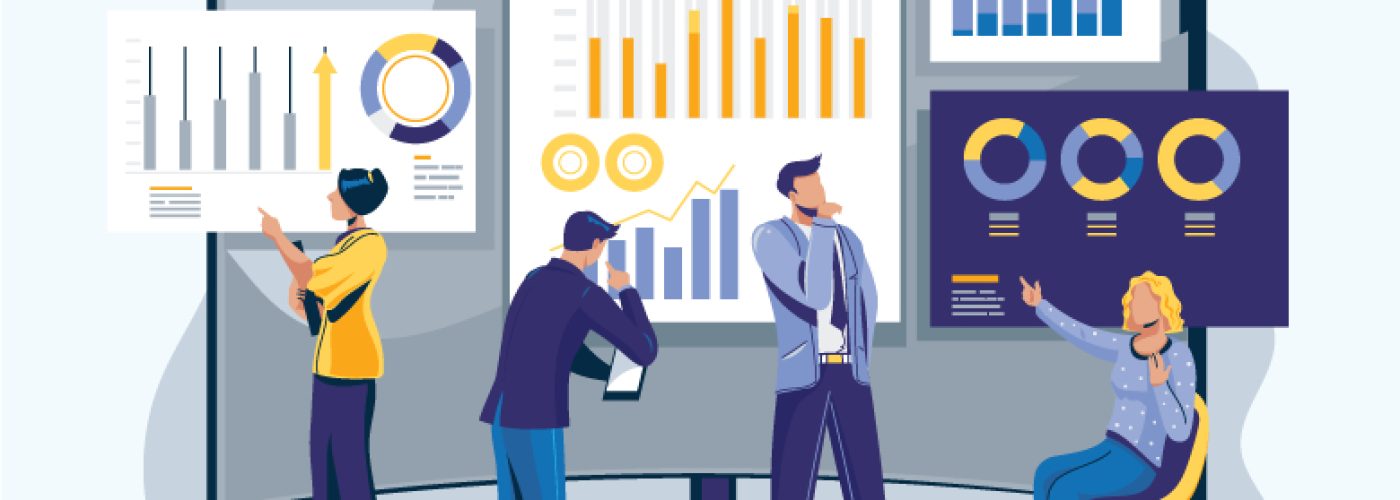
Imagine you could see all your project’s data in one place. That’s what data visualization tools offer, and it’s transforming project management.
Forget endless spreadsheets and confusing charts.
These tools give you real-time insights and interactive dashboards that simplify decision-making.
Power BI leads the way with its user-friendly interface.
It’s not just for techies; even if you’re new to it, you’ll find plenty of courses to help you master it quickly.
Want to know how this can boost efficiency in construction projects? Keep reading. We’ll explore practical applications and future trends that can make your job easier and more effective.
Real-Time Data for Timely Decisions
Accessing real-time data can revolutionize your project management approach. Imagine tracking material deliveries or labor hours as they occur. This immediate feedback helps you adapt quickly, avoiding costly delays.
This is what happens when you use tools like Power BI and Tableau: You gain an edge in responding to site conditions or supplier issues instantly.
For example, Power BI integrates with various construction software to pull live updates into a centralized dashboard. If there’s a delay in concrete delivery, the system alerts you right away, enabling swift rescheduling.
Real-time data empowers managers to spot trends early and make proactive adjustments. You get to maintain control over timelines and budgets without waiting for end-of-day reports.
Ultimately, implementing these tools means fewer surprises and more streamlined operations across your projects.
Interactive Dashboards Simplify Complex Projects
Keeping your project organized can make or break its success. And thankfully, interactive dashboards take the guesswork out of managing complex tasks. Tools like Tableau and Google Data Studio allow you to visualize key metrics at a glance.
You no longer need to dig through multiple reports; instead, you see everything in one place.
These dashboards let you track progress, budget, and resource allocation seamlessly. For example, you can set up a dashboard to monitor daily labor costs versus projected expenses. This quick access enables immediate course corrections if spending veers off-track.
By centralizing data visualization, interactive dashboards streamline communication among team members and stakeholders as well. Everyone stays on the same page without constant email updates or meetings.
Integrating Power BI with Other Construction Tools
Seamlessly integrating Power BI with your existing construction tools can significantly boost efficiency. When you connect software like Procore, Autodesk, or Primavera P6 to Power BI, you bring all essential data into a unified platform.
Here are three major benefits:
- Centralized Data: Aggregate information from different sources for better visibility.
- Enhanced Reporting: Generate comprehensive reports without manual data entry.
- Real-Time Collaboration: Share insights instantly with your team.
Centralized data means no more toggling between apps to gather project updates. Enhanced reporting enables detailed analysis and forecasting based on current metrics. And real-time collaboration ensures everyone works off the same set of facts.
For instance, linking Procore’s project management features directly to Power BI lets you create dynamic dashboards showing everything from task progress to budget health. As earlier hinted, you can identify issues before they escalate and make informed decisions promptly.
Yet to acquire the knowledge? It’s simple in the digital age. Learning these integration techniques through Power BI courses online equips you with the skills needed to optimize tool synergies effectively in your projects.
Predictive Analytics to Foresee Project Challenges
Understanding potential pitfalls ahead of time is crucial in project management. Predictive analytics tools make this possible by analyzing patterns and trends.
Here are three key advantages:
- Risk Mitigation: Identify high-risk areas before they impact timelines.
- Resource Optimization: Allocate resources more effectively based on forecasted needs.
- Cost Efficiency: Avoid budget overruns with proactive financial planning.
Imagine using predictive analytics software like Oracle Primavera Cloud. It can predict delays due to weather conditions or supply chain issues, enabling you to adjust schedules preemptively.
This technology doesn’t just save time; it reduces unforeseen costs too.
With the integration of AI in real estate development rapidly growing, these tools will become even more sophisticated. They’ll provide deeper insights into project viability and resource allocation, helping you plan better from start to finish.
Enhancing Team Collaboration through Visualization
Clear communication is essential for project success. And in line with this, interactive data visualization tools can bridge gaps among team members.
Project managers could leverage these tools to share live updates, ensuring everyone stays informed. Collaborative features in platforms like Tableau or Google Data Studio allow multiple users to work on the same dataset simultaneously.
To benefit even more from such tools, consider integrating them into your regular workflow meetings. This practice fosters transparency and keeps all stakeholders aligned with real-time project developments.
Cost Management Using Visual Insights
The element of cost is as crucial as the project itself. Needless to reiterate, visual insights help you track expenses in real-time and spot potential overruns early. Project managers can utilize tools like Microsoft Power BI to create dashboards displaying budget allocations, expenditures, and financial forecasts.
By visualizing these metrics, you maintain tighter control over spending. Additionally, automated alerts for deviations keep finances on track without manual intervention. This proactive approach ensures efficient resource allocation throughout the project’s lifecycle. In winding up, leveraging data visualization tools can streamline your construction projects. Stay ahead with real-time insights and enhance collaboration for more efficient and successful outcomes.


