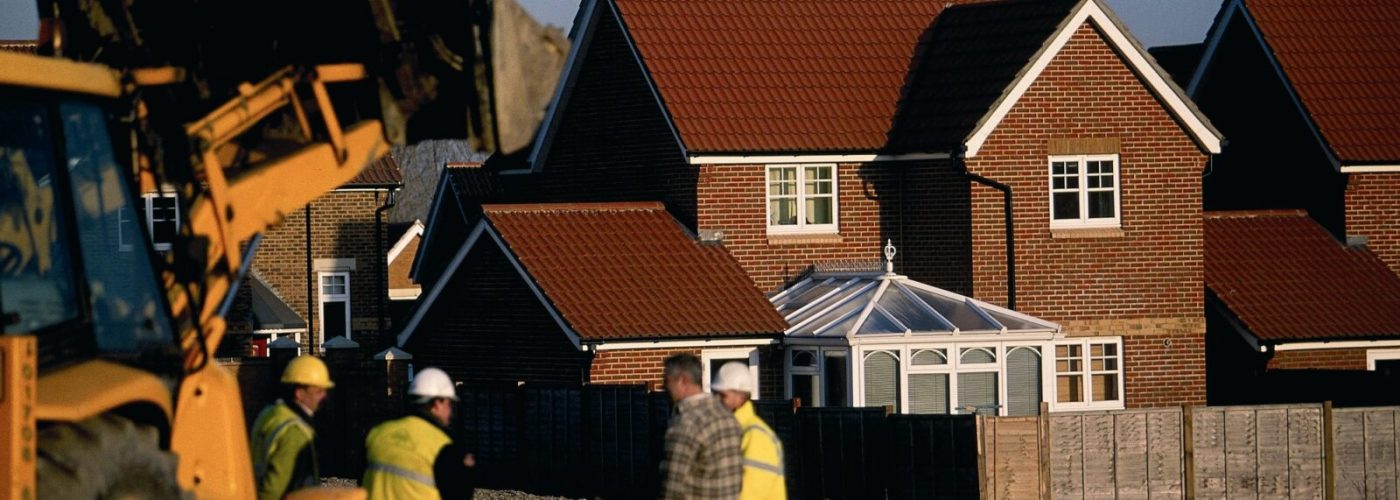
The latest research from Warwick Estates has revealed how the new-build market has outperformed the rest both where price growth and price premiums are concerned since the turn of the Millenium.
The average homeowner is thought to spend 21 years in a home on average, so Warwick Estates analysed new-build and existing house prices between 2000 and 2021 and found that across England and Wales, the average new-build has increased in value considerably.
In 2000, the average new-build cost £92,234, but today, this has increased to £343,185 – a 272% increase. While the existing market has also seen impressive growth, the average house price has increased by just 254% in comparison.
The premium attached to new-build homes has also jumped by some margin. In 2000, the average new-build home cost £17,805 more than the average existing property. Today, this premium has climbed to £79,426.
London has seen the biggest jump in new-build values, up from an average of £133,568 in 2000, to £525,927 – a 294% increase and 19% more than the existing market where prices are up 275%.
The East Midlands (290%) and the East of England (290%) have also seen some of the largest increases and have also outperformed the existing market to the largest extent, with a 27% and 26% respective difference in price growth during this time.
However, all areas of England and Wales have seen new-build house price growth not only exceed 200% since the start of the new Millennium but also outpace the existing market.
The East of England has also seen the largest increase in new-build premiums. In 2000, new-builds were valued £19,345 higher than existing homes, but today this has climbed to £97,435 – a £78,090 increase.
The East Midlands (£73,222), the West Midlands (£66,255) and the South West (£60,998) have also seen the premium attached to new-build homes climb by more than £60,000 in the last two decades.
COO of Warwick Estates, Bethan Griffiths, commented:
“New-build homes have always commanded a premium and this premium has climbed considerably in the last two decades as house prices have risen, but also the quality and offering of the new-build sector has evolved.
While getting a foot on the new-build ladder may present a tougher task for aspirational homeowners initially, they are far more likely to see their investment not only hold its value but increase at a greater rate than the existing market. So it can be well worth the additional initial financial investment for those with a long-term view of homeownership.”
| Table shows the increase in the average value of new-build and existing homes between 2000 and 2021 | ||||||
| Location | Average NB house price (Mar 2021) | Change – 2000 to 2021 (£) | Change – 2000 to 2021 (%) | Average Existing house price (Mar 2021) | Change – 2000 to 2021 (£) | Change – 2000 to 2021 (%) |
| London | £525,927 | £392,359 | 294% | £503,386 | £369,173 | 275% |
| Yorkshire and The Humber | £243,791 | £180,320 | 284% | £181,826 | £131,985 | 265% |
| East of England | £404,852 | £300,939 | 290% | £307,417 | £222,849 | 264% |
| East Midlands | £302,701 | £225,162 | 290% | £209,735 | £151,941 | 263% |
| North West | £262,731 | £192,821 | 276% | £184,362 | £133,006 | 259% |
| Wales | £252,646 | £182,754 | 261% | £182,699 | £131,557 | 257% |
| West Midlands Region | £305,790 | £217,404 | 246% | £214,363 | £151,150 | 239% |
| South West | £348,888 | £250,269 | 254% | £281,886 | £198,732 | 239% |
| South East | £420,199 | £298,520 | 245% | £344,314 | £237,522 | 222% |
| North East | £217,985 | £147,457 | 209% | £138,631 | £91,648 | 195% |
| England and Wales | £343,185 | £250,951 | 272% | £263,760 | £189,330 | 254% |
| Data sourced from the Land Registry House Price Index – New-build vs Existing (March 2000 to March 2021 – latest available) | ||||||
| Table shows the new-build price premium in 2000 and 2021 and the change between the two | |||||||
| Location | Average NB house price (Mar 2000) | Average Existing house price (Mar 2000) | NB price premium (2000) | Average NB house price (Mar 2021) | Average Existing house price (Mar 2021) | NB price premium (2021) | Change in NB premium (£) |
| East of England | £103,913 | £84,568 | £19,345 | £404,852 | £307,417 | £97,435 | £78,090 |
| East Midlands | £77,539 | £57,794 | £19,744 | £302,701 | £209,735 | £92,966 | £73,222 |
| West Midlands Region | £88,386 | £63,213 | £25,173 | £305,790 | £214,363 | £91,427 | £66,255 |
| South East | £121,678 | £106,792 | £14,887 | £420,199 | £344,314 | £75,885 | £60,998 |
| North West | £69,910 | £51,357 | £18,553 | £262,731 | £184,362 | £78,368 | £59,815 |
| North East | £70,528 | £46,982 | £23,546 | £217,985 | £138,631 | £79,355 | £55,809 |
| South West | £98,618 | £83,154 | £15,464 | £348,888 | £281,886 | £67,002 | £51,538 |
| Wales | £69,892 | £51,142 | £18,750 | £252,646 | £182,699 | £69,947 | £51,197 |
| Yorkshire and The Humber | £63,471 | £49,841 | £13,630 | £243,791 | £181,826 | £61,966 | £48,335 |
| London | £133,568 | £134,213 | -£645 | £525,927 | £503,386 | £22,541 | £23,186 |
| England and Wales | £92,234 | £74,430 | £17,805 | £343,185 | £263,760 | £79,426 | £61,621 |
| Data sourced from the Land Registry House Price Index – New-build vs Existing (March 2000 to March 2021 – latest available) | |||||||


