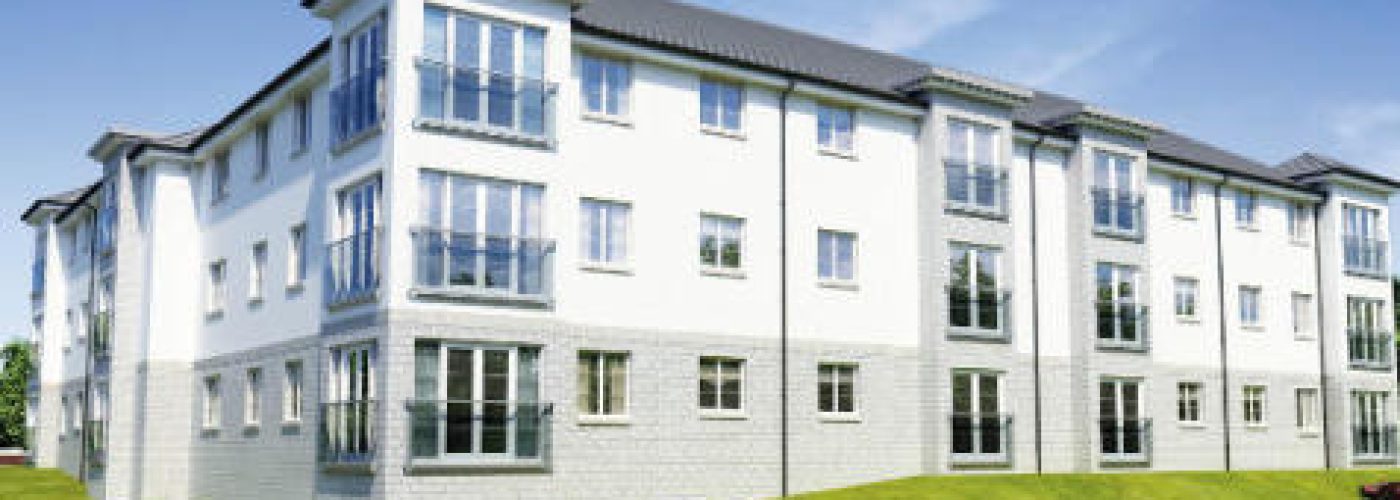
The latest research from Warwick Estates has revealed which coastal locations offer the most new-build availability for those looking to buy by the seaside.
Warwick Estates analysed new-build availability across 45 of the best coastal towns across the nation based on the number of new builds available on the current market as a percentage of all properties listed for sale.
The research shows that on average, just five per cent of all homes currently listed across coastal locations are new builds.
However, Newquay in Cornwall offers the best chance of a new-build by the sea, with one in five homes currently listed for sale coming via the new homes sector.
Shoreham-by-Sea in the South East is also home to some of the largest levels of coastal new-build availability, with new homes accounting for 12% of all homes currently on the market.
Poole (11%) and Margate (10%) are the only other coastal locations where new-builds account for more than 10% of current for sale stock, while Deal (9%), Exmouth (9%), Scarborough (9%), Herne Bay (8%), Falmouth (8%) and Littlehampton (8%) also make the top 10.
In contrast, there are currently no new-build homes listed for sale in Burnam-on-Sea, Stubbington or Fleetwood.
COO of Warwick Estates, Bethan Griffiths, commented:
“The property market DNA of many coastal locations has long been decided and the lack of available space means you will probably be hard-pressed to find a new-build with sea views.
However, as our research shows, some coastal favourites are home to a limited level of new-build stock and so the dream of a new-build by the sea isn’t completely out of the question.
While the chances are higher in some areas compared to others, those with their heart set on such a purchase should be able to find a coastal new-build contender in almost every region of the UK market.”
| Table shows new-build availability in each coastal town based on the number of new-builds for sale as a percentage of all homes listed for sale | ||||
| Location | Region | Total stock listed for sale | New-build stock listed for sale | % proportion of NB |
| Newquay | South West | 373 | 74 | 19.8% |
| Shoreham-by-Sea | South East | 407 | 47 | 11.5% |
| Poole | South West | 2696 | 290 | 10.8% |
| Margate | South East | 719 | 75 | 10.4% |
| Deal | South East | 462 | 43 | 9.3% |
| Exmouth | South West | 524 | 48 | 9.2% |
| Scarborough | Yorkshire and The Humber | 1017 | 93 | 9.1% |
| Herne Bay | South East | 728 | 61 | 8.4% |
| Falmouth | South West | 325 | 27 | 8.3% |
| Littlehampton | South East | 950 | 78 | 8.2% |
| Ramsgate | South East | 588 | 46 | 7.8% |
| Great Yarmouth | East of England | 1,045 | 81 | 7.8% |
| Christchurch | South West | 508 | 36 | 7.1% |
| Felixstowe | East of England | 523 | 34 | 6.5% |
| Whitstable | South East | 625 | 40 | 6.4% |
| Folkestone | South East | 830 | 49 | 5.9% |
| Worthing | South East | 1895 | 111 | 5.9% |
| Weymouth | South West | 762 | 43 | 5.6% |
| Weston-Super-Mare | South West | 1561 | 88 | 5.6% |
| Southport | North West | 1,374 | 75 | 5.5% |
| Broadstairs | South East | 429 | 23 | 5.4% |
| Torquay | South West | 1289 | 66 | 5.1% |
| Formby | North West | 275 | 14 | 5.1% |
| Clacton-on-Sea | East of England | 993 | 49 | 4.9% |
| Lowestoft | East of England | 1,031 | 49 | 4.8% |
| Bournemouth | South West | 3777 | 159 | 4.2% |
| Eastbourne | South East | 1,698 | 71 | 4.2% |
| Seaford | South East | 314 | 13 | 4.1% |
| Cleethorpes | Yorkshire and The Humber | 348 | 14 | 4.0% |
| Bridlington | Yorkshire and The Humber | 483 | 18 | 3.7% |
| Bexhill | South East | 1,027 | 36 | 3.5% |
| Bognor Regis | South East | 1102 | 37 | 3.4% |
| Skegness | East Midlands | 290 | 9 | 3.1% |
| Southend-on-Sea | East of England | 1,134 | 30 | 2.6% |
| Paignton | South West | 812 | 21 | 2.6% |
| Redcar | North East | 423 | 8 | 1.9% |
| Clevedon | South West | 275 | 5 | 1.8% |
| Hastings | South East | 1,571 | 21 | 1.3% |
| Blackpool | North West | 2,106 | 25 | 1.2% |
| Morecambe | North West | 561 | 5 | 0.9% |
| Lytham St Anne’s | North West | 824 | 5 | 0.6% |
| Whitley Bay | North East | 340 | 1 | 0.3% |
| Fleetwood | North West | 313 | 0 | 0.0% |
| Stubbington | South East | 187 | 0 | 0.0% |
| Burnham-on-Sea | South West | 246 | 0 | 0.0% |
| Average | 39760 | 2118 | 5.3% | |
| Data sourced from Rightmove (25/08/2021) | ||||


