Residential : House Builders & Developers News
Waterfront Apartments with Panoramic River Views Open for Viewings

Waterfront Apartments with Panoramic River Views Open for Viewings

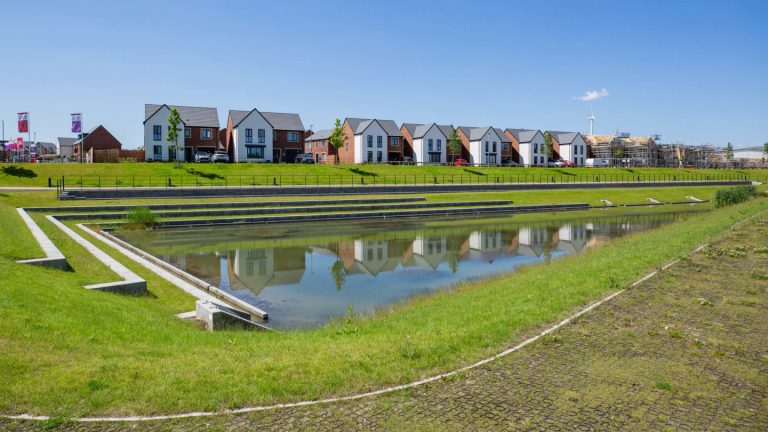
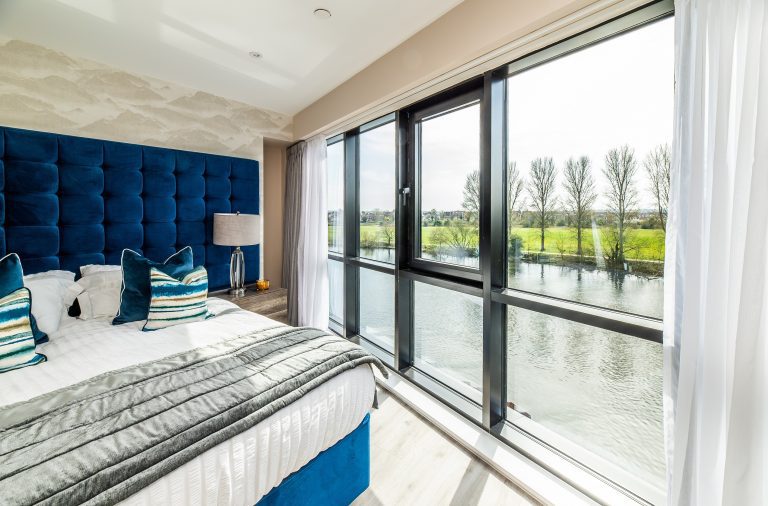
Trent Bridge Quays, a new residential development of 95 homes on the banks of the River Trent, has now opened the first waterfront apartments to prospective buyers looking for their dream waterside property. Located on Meadow Lane, a short distance from the centre of Nottingham and close to West Bridgford,

Read More »

Luxury new home searches soar by 25%

Data released today in the WhatHouse? New Homes Index reveals that buyer interest in luxury new build homes across Britain has increased by 25% during July, a sign that changing space requirements and lifestyle priorities continue to alter the new home market.   Looking ahead, we expect this growth to continue, as post-pandemic life returns to normal and home buyers can make firm decisions based on new lifestyle requirements.        The national average price

Read More »
The Most Expensive UK Properties Currently for Sale

The Most Expensive UK Properties Currently for Sale

From vineyards and tennis courts, to heated pools and huge cinema rooms, the UK’s most expensive properties benefit from perks that the majority of us could only dream of, but where exactly are the priciest properties on sale in the UK currently located? Using its new Lustworthy Listings explorer, an

Read More »
Latest Issue
Issue 334 : Nov 2025

Residential : House Builders & Developers News

London remains the leasehold hotspot for homebuyers, but North West isn’t far behind

The latest research from Warwick Estates has revealed which regions of the property market in England and Wales are currently the leasehold homebuyer hotspots. Warwick Estates analysed price paid data from the Land Registry over the last 12 months to see where the most leasehold homes are selling. The figures show that across England and Wales, 651,488 homes have sold in the last 12 months, 117,892 of which have been leaseholds, accounting for 18% of all market activity. London continues to lead where leasehold property popularity is concerned. 44% of all homes sold across the capital in the last year have been leasehold, by far the highest proportion of all regions. However, the North West ranks second, where the 25,858 leasehold sales equate to 32% of all market activity. The South East completes the top three regions with the most leasehold homes sold, with 15% of all transactions in the last year being for leasehold properties. In contrast, just 6% of homes sold across the East Midlands in the last year have been leasehold, while Wales (8%) and the West Midlands (11%) are also home to some of the lowest leasehold homebuyers. COO of Warwick Estates, Bethan Griffiths, commented: “The leasehold lifestyle appeals to a certain type of homebuyer and so there will always be a large regional disparity where the proportion of market activity attributable to leasehold sales is concerned. They remain a popular choice in many larger cities where apartment living, in particular, is the lifestyle of choice for many. They also provide a more affordable option for those purchasing in inflated pockets of the market. However, we’re now seeing an increase in popularity due to the social and communal aspects that many leasehold developments offer. This has become an important feature for many since the nation was plunged into lockdown and will remain a prominent aspect of life after the pandemic.” Location All transactions Leasehold transactions Leasehold % London 69,265 30,683 44% North West 79,685 25,858 32% South East 118,696 18,234 15% South West 75,991 10,877 14% North East 27,305 3,791 14% Yorkshire and the Humber 60,108 7,493 12% East of England 77,030 8,932 12% West Midlands region 57,560 6,307 11% Wales 31,437 2,501 8% East Midlands 54,411 3,216 6% England 620,051 115,391 19% England and Wales 651,488 117,892 18% Data sourced from the Land Registry Price Paid data records for residential property sales, excluding properties listed by type as ‘other’, between August 2020 and July 2021.        

Read More »
Waterfront Apartments with Panoramic River Views Open for Viewings

Waterfront Apartments with Panoramic River Views Open for Viewings

Trent Bridge Quays, a new residential development of 95 homes on the banks of the River Trent, has now opened the first waterfront apartments to prospective buyers looking for their dream waterside property. Located on Meadow Lane, a short distance from the centre of Nottingham and close to West Bridgford, Trent Bridge Quays provides buyers the best of both locations, with developer Elevate Property Group drawing on the character of the local industrial, and historical architecture which has inspired the development’s design. “The development has generated significant interest since construction began, with over 90% of the first release of homes already sold, with a further 58 recently launched in the second release also selling well,” said sales director at Elevate Property Group, David Hofton. Selling agent FHP Waterside Living, is holding an open day on Saturday 4 September for potential buyers to have the first look around the apartments and to get a feel for what living by the water is like. Trent Bridge Quays hold a prominent position on the River Trent, with water views spanning from Victoria Embankment across to Lady Bay Bridge. No longer the choice of the privileged few, waterfront living means space, freedom and privacy. One, two and three-bed luxury waterfront apartments are available, with prices ranging from £220,000 for a one-bed duplex, to £1m for a 1722 sq ft penthouse with a 904 sq ft roof terrace. Help to Buy options are available for first time buyers on all one bed apartments. Three story four-bed townhouses with ‘morning and afternoon’ balconies to enjoy sunrise and sunset vistas along with parking and gardens start from £495,000. “With its interconnecting green spaces, a rich tapestry of independent shops, bars and restaurants, Trent Bridge Quays is right at the heart of a new chapter in Nottingham’s history,” added Joe Hargreaves, property consultant at FHP Waterside Living and lead estate agent for Trent Bridge Quays. “I have witnessed many buyers fall in love with this development – and now that potential buyers can view the waterfront apartments for themselves, I’m sure they will be extremely popular and I’m looking forward to welcoming guests on our open day early next month.” Trent Bridge Quays forms part of Nottingham’s vision to transform the heritage of the river and canal side. It also provides the ideal location for access to world renowned sport with Notts County and Nottingham Forest football clubs and Trent Bridge Cricket Ground a short walk away, as is as it peaceful open spaces such as Holme Pierrepoint Country Park and The Hook nature reserve in Lady Bay.

Read More »

The biggest homebuyer turnoffs that could knock up to £50k of your property value

The latest research from the homebuying platform, Yes Homebuyers, reveals the biggest homebuyer turnoffs, from subsidence to nuisance neighbours, and the financial consequence they can have on the value of a home. Homebuying is a complex process that requires due diligence and thorough attention to detail. It is also likely to be the biggest financial commitment a person has made throughout their life. As such, potential pitfalls or problems with a home can dramatically impact its desirability and, ultimately, its value. Yes Homebuyers has identified the biggest homebuyer turnoffs and calculated what impact each can have on the value of a property, and in a list of 15 problem areas, nothing is considered more of a deterrent than subsidence. Subsidence refers to situations when the ground beneath a property is sinking, pulling the foundations of the home down with it and it’s estimated that it can reduce the value of a home by an average of -20%. For the average home which, in the UK, is currently valued at £254,624, this -20% loss equates to £51,000. Second on the list is Japanese Knotweed, a destructive plant that can grow up to 10cm in a single day. It can cause severe damage to the structural integrity of a property and thus reduces the value of a home by -15% – a drop of just over £38,000. If a property is suffering from poor upkeep or the garden has been allowed to overgrow it could reduce the value of a home by as much as -14% on average, or £36,000. If new power lines, mobile phone towers, or wind turbines are planned nearby to your property, especially if visible from the house itself, buyers are going to be far less inclined to pay top price for your home. Typically, such a scenario can see an average of -13%, or £33,000, wiped off in value. Both nuisance neighbours and flood risks or water damage can reduce a property’s value by -10%, equal to just under £25,500; lack of convenient parking can reduce value by -7.1%, or £18,000; and unlucky house number, such as 13, can, believe it or not, reduce the value of a home by -6%, just north of £15,000. Structural issues (-£13,500), local power stations (-£12,700), damage or odours left by pets in the home (-£10,200), cluttered rooms (-£10,200), damp and mould (-£2,500), asbestos (-£2,500), and woodworm (-£1,300) can also have a negative impact on the value of your home. However, the latter issues, like asbestos and woodworm can be very hard to detect and so you might not even know they’re there yourself. Matthew Cooper, Founder & Managing Director of Yes Homebuyers, commented: “Many of these buyer turnoffs can be easily and cheaply fixed, a process which should be well worth the effort and money thanks to the value they will restore to your home. Some of them, however, can be very expensive indeed. Severe damp issues and subsidence, for example, could cost as much to rectify as the value they restore. Furthermore, they can take an awfully long time to fix. “In such instances, it might be worth considering selling your home at a reduced price rather than undertake the task yourself. Of course, you might struggle to find a buyer, as a result, but in most cases, a bonafide quick buy platform should take your property off your hands. Leaving you stress-free and able to focus on your onward purchase.” Table shows the biggest homebuyer turn offs based on the average percentage each issue can reduce value by and what this means based on the current average UK house price Turn-offs Ave est % impact on property price Potential property value decrease Sources Subsidence -20% -£50,925 link link Japanese Knotweed -15% -£38,194 link link Poor upkeep and overgrown gardens -14.1% -£35,902 link link New powerlines, mobile phone towers, wind turbines -13% -£33,101 link   Bad/nuisance neighbours -10% -£25,462 link link Water damage / known flood plain/flooding risk -10% -£25,462 link link Poor parking / no parking available -7.1% -£18,078 link link Unlucky house numbers (number 13) -6.0% -£15,277 link link Structural issues/damage -5.3% -£13,495 link   Power stations within local area -5% -£12,731 link   Evidence of pets -4.0% -£10,185 link link Untidy / messy/dirty/cluttered -4.0% -£10,185 link   Damp/rising damp/mould -1% -£2,546 link link Asbestos -1% -£2,546 link link Woodworm -0.5% -£1,273 link link Potential property price impact based on each percentage applied to the current UK average house price of £254,624 – Gov.uk UK House Price Index (May 2021 – latest data available)          

Read More »

Luxury new home searches soar by 25%

Data released today in the WhatHouse? New Homes Index reveals that buyer interest in luxury new build homes across Britain has increased by 25% during July, a sign that changing space requirements and lifestyle priorities continue to alter the new home market.   Looking ahead, we expect this growth to continue, as post-pandemic life returns to normal and home buyers can make firm decisions based on new lifestyle requirements.        The national average price of new home property coming to market has stayed static at £338,339 in July (£338,042 in June).          Top three new home search areas during July:       South East of England has demonstrated the most buyer demand during July 2021, achieving 25,719 new home buyer searches.        West Midlands continued its climb for the second month in a row, jumping from third to second position, achieving 23,683 new home buyer searches during July 2021.        North East of England has secured its first top three search position with 13,581 new home buyer searches during July 2021, representing a 170% increase on June’s figures.         July has achieved a +32% increase in new home demand, recording a total of 166,137 new home buyer searches, compared to 126,199 during June 2021.  Daniel Hill, Managing Director, WhatHouse? comments:  “Changing lifestyle requirements continue to re shape the new home market, and nowhere is this demonstrated more clearly than in July’s WhatHouse? New Homes Index.  London has been ousted from the top three new home search table, supplanted by West Midlands and North East, both experiencing spikes in search.  It’s also interesting to note that total luxury new home searches increased by 25% during July.  The East Midlands, West Midlands, North West and Scotland all top performers – reporting a +45% luxury new home search increase since June.          This all points to a large scale post-Covid re-evaluation amongst home buyers.  As employers firm up plans for flexible work-from-home expectations, home buyers are now able to confidently consider space requirements and lifestyle aspirations.  What the WhatHouse? New Homes Index is demonstrating is a growing desire amongst buyers to consider luxury new homes in regions that may previously have been beyond their search comfort zone.” David O’Leary, Policy Director, Home Builders Federation said:  “As the wider market settles into equilibrium, demand for new homes continues to be robust with many builders reporting strong forward order books. More than ever homebuyers, both first-time buyers and home movers, appear to be putting an emphasis on the low running costs and improved energy efficiency that new homes provide.” 

Read More »

New-build prices up 272% this Millenium as price premium climbs by £78,090

The latest research from Warwick Estates has revealed how the new-build market has outperformed the rest both where price growth and price premiums are concerned since the turn of the Millenium. The average homeowner is thought to spend 21 years in a home on average, so Warwick Estates analysed new-build and existing house prices between 2000 and 2021 and found that across England and Wales, the average new-build has increased in value considerably. In 2000, the average new-build cost £92,234, but today, this has increased to £343,185 – a 272% increase. While the existing market has also seen impressive growth, the average house price has increased by just 254% in comparison. The premium attached to new-build homes has also jumped by some margin. In 2000, the average new-build home cost £17,805 more than the average existing property. Today, this premium has climbed to £79,426. London has seen the biggest jump in new-build values, up from an average of £133,568 in 2000, to £525,927 – a 294% increase and 19% more than the existing market where prices are up 275%. The East Midlands (290%) and the East of England (290%) have also seen some of the largest increases and have also outperformed the existing market to the largest extent, with a 27% and 26% respective difference in price growth during this time. However, all areas of England and Wales have seen new-build house price growth not only exceed 200% since the start of the new Millennium but also outpace the existing market. The East of England has also seen the largest increase in new-build premiums. In 2000, new-builds were valued £19,345 higher than existing homes, but today this has climbed to £97,435 – a £78,090 increase. The East Midlands (£73,222), the West Midlands (£66,255) and the South West (£60,998) have also seen the premium attached to new-build homes climb by more than £60,000 in the last two decades. COO of Warwick Estates, Bethan Griffiths, commented: “New-build homes have always commanded a premium and this premium has climbed considerably in the last two decades as house prices have risen, but also the quality and offering of the new-build sector has evolved. While getting a foot on the new-build ladder may present a tougher task for aspirational homeowners initially, they are far more likely to see their investment not only hold its value but increase at a greater rate than the existing market. So it can be well worth the additional initial financial investment for those with a long-term view of homeownership.” Table shows the increase in the average value of new-build and existing homes between 2000 and 2021 Location Average NB house price (Mar 2021) Change – 2000 to 2021 (£) Change – 2000 to 2021 (%) Average Existing house price (Mar 2021) Change – 2000 to 2021 (£) Change – 2000 to 2021 (%) London £525,927 £392,359 294% £503,386 £369,173 275% Yorkshire and The Humber £243,791 £180,320 284% £181,826 £131,985 265% East of England £404,852 £300,939 290% £307,417 £222,849 264% East Midlands £302,701 £225,162 290% £209,735 £151,941 263% North West £262,731 £192,821 276% £184,362 £133,006 259% Wales £252,646 £182,754 261% £182,699 £131,557 257% West Midlands Region £305,790 £217,404 246% £214,363 £151,150 239% South West £348,888 £250,269 254% £281,886 £198,732 239% South East £420,199 £298,520 245% £344,314 £237,522 222% North East £217,985 £147,457 209% £138,631 £91,648 195% England and Wales £343,185 £250,951 272% £263,760 £189,330 254% Data sourced from the Land Registry House Price Index – New-build vs Existing (March 2000 to March 2021 – latest available)               Table shows the new-build price premium in 2000 and 2021 and the change between the two Location Average NB house price (Mar 2000) Average Existing house price (Mar 2000) NB price premium (2000) Average NB house price (Mar 2021) Average Existing house price (Mar 2021) NB price premium (2021) Change in NB premium (£) East of England £103,913 £84,568 £19,345 £404,852 £307,417 £97,435 £78,090 East Midlands £77,539 £57,794 £19,744 £302,701 £209,735 £92,966 £73,222 West Midlands Region £88,386 £63,213 £25,173 £305,790 £214,363 £91,427 £66,255 South East £121,678 £106,792 £14,887 £420,199 £344,314 £75,885 £60,998 North West £69,910 £51,357 £18,553 £262,731 £184,362 £78,368 £59,815 North East £70,528 £46,982 £23,546 £217,985 £138,631 £79,355 £55,809 South West £98,618 £83,154 £15,464 £348,888 £281,886 £67,002 £51,538 Wales £69,892 £51,142 £18,750 £252,646 £182,699 £69,947 £51,197 Yorkshire and The Humber £63,471 £49,841 £13,630 £243,791 £181,826 £61,966 £48,335 London £133,568 £134,213 -£645 £525,927 £503,386 £22,541 £23,186 England and Wales £92,234 £74,430 £17,805 £343,185 £263,760 £79,426 £61,621 Data sourced from the Land Registry House Price Index – New-build vs Existing (March 2000 to March 2021 – latest available)                

Read More »
The Most Expensive UK Properties Currently for Sale

The Most Expensive UK Properties Currently for Sale

From vineyards and tennis courts, to heated pools and huge cinema rooms, the UK’s most expensive properties benefit from perks that the majority of us could only dream of, but where exactly are the priciest properties on sale in the UK currently located? Using its new Lustworthy Listings explorer, an online tool that lets users input any postcode in order to discover the most expensive properties for sale in the area, the mortgage experts at money.co.uk have pulled together a list of the costliest abodes currently available to purchase. 1.London – 8-bed terraced townhouse: £77,500,000 Sitting on Belgrave Square, the stunningly decadent eight-bed terraced townhouse boasts scenic views from its balcony and roof terrace, and is currently the most expensive publicly listed home for sale on the UK market. In order to enjoy the outdoor surroundings, residents have the option of either accessing the exclusive Belgrave Square Gardens or using their own private garden to relax in. With on-street parking (gold dust in Central London), residents can even pull right up to the door of their property after a long day taking in the beauty of the UK capital. Nearby: Knightsbridge is a short stroll away, where residents can treat themselves to such high-end eating establishments as Zuma London and the Harrods Tea Room. The bustling Sloane Street is also a stone’s throw away, lined with luxury boutiques and exclusive shopping stores. Buckingham Palace is just a four-minute drive away if the lucky owners ever feel like leaving the luxury of their £77m home and visiting one worth a staggering £4.9 billion. Mortgage deposit: £7,750,000 Monthly repayments: £231,055 2.Leeds – 8-bed Grade II country house: £3,500,000 This recently renovated Grade II listed Georgian country house combines unique period features – which date back to 1750 – with modern technology and interiors. Nestled away privately on Scotland Lane, Horsforth, its long driveway leads up to the estate through the immaculate private grounds that are just under seven acres. Designed for entertaining and hosting, the house boasts a cinema room, wine cellar, gym, large car garage and an annexe/guest wing for visiting friends and family. But unless you’re invited in or can afford the hefty £3.5 million price tag, this is the closest you’ll get to seeing it, as it’s safely guarded by an electronic gate system and state of the art security cameras. Nearby: The town of Horsforth has a variety of bars and restaurants to explore and caters to all tastes, from independent Greek tavernas to Italian trattorias. Leeds City Centre is only five miles away, where you can visit Trinity Shopping Centre. The Yorkshire Dales are also close by for long walks out in the fresh air to get back to nature. For international travellers and jetsetters, there is also the benefit of Leeds Bradford Airport being located a two-minute drive away from the house. Mortgage deposit: £350,000 Monthly repayments: £10,434 3.Nottingham- 8-bed architect-designed house: £2,950,000 This unique, architect-designed house is another one of the most expensive properties in the UK. It lies on the highly sought after location of Melton Road, Edwalton, and combines privacy with the convenience of being close to West Bridgford. The four-floor property features a grand reception room, leisure facilities, eight bedrooms, including guest accommodation on the second floor with a large bedroom, en suite and an open plan living/dining/kitchen. The wrap-around balcony encasing the property measures over 1,200 sq ft in length, and makes the perfect setting for relaxing and taking in views of the sunset. Unsurprisingly, the home comes equipped with a variety of high tech perks. As well as a video entry gate system and CCTV to keep residents safer, there are also remote-activated blinds, an air handling/recovery system, and a Sonos Sound System to provide musical entertainment across every room. Nearby: The City Ground, home to the Nottingham Forest Football Club since 1898, is just 7.3 miles away. Also nearby is the world-famous cricketing landmark Trent Bridge, built in 1838 and the third oldest Test ground in the world. West Bridgford has plenty of quality restaurants to choose from, with delicious tapas at Escabeche and gastropub The Tailors Arms among the most popular. Nottingham City Centre and its wealth of shops, bars and restaurants is also located just 8.7 miles from the home. Mortgage deposit: £295,000 Monthly repayments: £8,795

Read More »

Nomad Developments showcases stunning waterfront gardens at Richmond Riverside as the race for space continues

Waterfront gardens provide beauty and versatility for stunning new family homesLarge South West London homes are leading demand in the capital (Savills)Demand remains 80% up on 2017-19 (Zoopla) As the race for space among property buyers continues, homes with impressive gardens certainly have the edge. Just three minutes’ walk from the centre of Richmond-Upon-Thames, in London, boutique property company Nomad Developments is showcasing just how versatile and stylish urban gardens can be, at its new Richmond Riverside development. The two properties that make up Richmond Riverside – Osprey House and Dunlin House – back onto the River Thames, with their own private mooring at the end of the garden. This has been a key influence over the design of the outdoor spaces, as their designer Matt Keightley, RHS Chelsea Flower Show & Silver-Gilt Award Winning Designer and Creative Director at Rosebank Landscaping, explains:   “It’s incredibly rare for developers to find sites in such prominent locations on the banks of the Thames in Richmond. Huge importance was therefore placed on making the most of the idyllic view across the water to the iconic bridge and over to the private island that provides such a beautiful screen from the popular weekend spot opposite.   “Multiple seating areas throughout the gardens will allow the prospective owners to appreciate this part of the river, including the broad biodiversity in the local area. End of garden boardwalks will give you the sense that you are quite literally sat on the river. It’s a beautiful and unprecedented spot.” Conceived as a direct connection to the wider landscape, as well as a beautiful extension to the two homes, the gardens have been carefully considered to make the most of the impressive views across the water. At the same time, practical considerations ranging from the tidal nature of the Thames to varied garden usage have been factored in. Railings have been used to allow debris collected with the tide to pass though rather than obstructing waterflow, while permeable surfaces will allow attenuation and natural soakaway. The boardwalk, meanwhile, will be constructed using a composite material to ensure its longevity. Zoned areas within the gardens at Richmond Riverside provide owners with plenty of versatility, whether they’re looking for a quiet spot to enjoy a relaxing cup of tea or to host an alfresco dinner for family and friends, all while maximising those stunning river views.   “It was important to provide a synergy between Richmond Riverside’s interior and exterior spaces. We’ve used floor to ceiling glass to draw the gardens and river views into the homes, creating a fundamental connection with nature that is perfectly aligned with buyers’ need for space and relaxation.”   Jack Simpson, Managing Director, Nomad Developments The desire for space has seen large family homes in South West London deliver a stellar performance in terms of demand over the second quarter of 2021. Savills reports that Richmond is one of four areas of London that is leading this demand. Prices in South West London rose by 1.8% between March and June, and by 4.7% over the past year, compared to just 0.9% for the overall prime London property market.   Zoopla’s June 2021 report also flags up the ‘search for space’ as a factor behind demand being 80% up compared to 2017-19. At Richmond Riverside, the gardens are certainly set to be part of the properties’ appeal to family buyers. They provide space for relaxing, lounging and dining, all threaded together with beautiful routes to walk and enjoy. There are areas of sun for those who prefer it and dappled shade for those who don’t.   The geometry of the design is softened by the use of soft planted perimeters to diffuse the boundary, allowing the gardens to ‘borrow’ the surrounding landscape and ensure the owners really connect with nature.   “A connection with nature is especially important for mental health in an urban environment. At Richmond Riverside, a series of tactfully placed trees will discreetly provide natural screens between the properties, whilst a tapestry of structural ground cover and perennial interest will make for immaculate and beautiful outside space. The cooling palette of colours will set the tone to be welcoming, curated and relaxing, while the textures, colours and aromas will be a stunning mix for the senses to enjoy.”   Matt Keightley, Creative Director, Rosebank Landscaping For more information, please visit www.nomaddevelopments.com or call 020 3488 7202.

Read More »

Scotland and London lead the way for new build property sales

The latest research from HouseScan has revealed that just 6.9% of all homes sold in Britain over the last year came via the new build sector, however, new build sales have driven the market to a greater extent across a number of locations. Since March of last year, 54,176 new build homes have been sold across Britain, accounting for 6.9% of all transactions during this period. Scotland has seen the greatest level of new builds sold as a proportion of total transactions, with 9.3% of all homes sold in the last 12 months coming via the sector. London has also seen some of the largest levels of transactions come via new build homes (8.8%), with the East Midlands (7.2%), West Midlands (7%), North East (6.9%) and South East (6.5%) also sitting above the national average. At local authority level, Scotland and London continue to rank with some of the highest levels of new build sales. Tower Hamlets has seen the most new build homes sold as a percentage of all transactions across Britain over the last year. The 991 new homes sold since March 2020 equate to 39.9% of all properties sold in the borough, closely followed by Newham where 33.4% of all transactions have been new builds. Scotland’s East Lothian (25.2%) and Midlothian (21.4%) also rank within the top five, along with Harborough in Leicestershire (20.9%). Greenwich (20.8%), Rugby (19.1%), South Derbyshire (18.5%), Hackney (17.6%) and Bracknell Forest (16.8%) also rank as some of the hottest spots for new build sales in the last year. Founder and Managing Director of HouseScan, Harry Yates, commented: “It seems as though Scotland is fast becoming Britain’s new build hotspot, with more transactions coming via the sector than anywhere else in the nation – including London. This demand has caused new build house price growth north of the border to climb considerably and although a buoyant new build market is unlikely to ease the pain of an early Euros exit, it’s certainly helping to lay some strong foundations for future generations of homebuyers.” Table shows new build transactions over the last 12 months as what percentage of total transactions they account for Location New build sales volume NB sales vol as % of all Scotland 8,432 9.3% London 6,337 8.8% East Midlands 4,383 7.2% East of England 5,621 7.0% West Midlands Region 4,457 7.0% North East 2,188 6.9% South East 7,913 6.5% North West 5,323 6.0% Yorkshire and The Humber 3,910 5.8% South West 4,545 5.7% Wales 1,067 3.2% England 44,677 6.7% Great Britain 54,176 6.9% New build sales volumes sourced from the Gov.uk UK House Price Index – New build vs Existing (March 2020 to Feb 2021 – latest available data)       Table shows the areas to have seen the largest number of new build transactions as a percentage of all transactions in the last 12 months Location New build sales volume NB sales vol as % of all Tower Hamlets 991 39.9% Newham 584 33.4% East Lothian 526 25.2% Midlothian 365 21.4% Harborough 331 20.9% Greenwich 512 20.8% Rugby 309 19.1% South Derbyshire 297 18.5% Hackney 291 17.6% Bracknell Forest 293 16.8% Wokingham 392 16.8% West Lothian 479 15.9% City of Peterborough 354 15.3% Central Bedfordshire 665 15.2% Stratford-on-Avon 286 14.8% New build sales volumes sourced from the Gov.uk UK House Price Index – New build vs Existing (March 2020 to Feb 2021 – latest available data)      

Read More »

289,000 new homes estimated to reach the market with snagging defects in 2021

The latest research from new build snagging experts, HouseScan, suggests that while there are currently 294,900 homes currently in the planning permission pipeline, an estimated 289,002 of these will reach the market with snagging issues. HouseScan’s analysis of Gov.uk data on the number of housing units to have been granted planning permission shows that planning permission approvals have fallen by -6.4% year on year. While there remain almost 300,000 new homes in the pipeline, HouseScan’s research also suggests that the vast majority of these will reach the market in an unsuitable state, with some form of snagging defect. It’s estimated just two per cent of all new build homes reach the market snag-free and this issue is predictably at its worst in the capital. Across London, there are some 52,300 homes waiting to be built having been granted permission, accounting for 18% of all approvals across England. However, with just two per cent predicted to reach the market in a suitable condition, HouseScan’s research shows that as many as 51,254 new homes yet to be built within the capital will have some form of snagging defect. If they were to reach the market today, that’s nearly £27bn worth of property that would need further work. With 43,200 housing units granted planning permission in the South East, it ranks as the region with the next largest level of homes reaching the market with snagging issues (42,336). The North West (39,592), East of England (34,790), East Midlands (30,380) and West Midlands (29,302) are also predicted to see some of the largest numbers of homes reach the market with snagging defects based on current planning permissions granted. In total across England, over £100bn worth of new homes that are still yet to be built will be sold with snagging issues, and that’s based on today’s market values alone.  Founder and Managing Director of HouseScan, Harry Yates, commented: “Unfortunately there’s an incredible number of new homes purchased every year that come complete with a number of snagging issues and these issues can range from something minor such as the poor fitting of light switches or plug sockets, to something as serious as subsidence or other structural instabilities. It may seem unfair to tarnish housebuilder outputs by using the law of averages, but to say that just two per cent of new builds are sold snag-free really is the reality. In addition, it’s the new build process that allows these issues by using similar practices, to begin with, with inspectors often passing off the standard of an entire development based on inspecting just one single home within it. Of course, our research has focussed on planning permissions and so it remains to be seen as to whether this level of homes will be riddled with snagging defects or not. However, we wanted to highlight this severe problem within the industry as a wake-up call so that those delivering this pipeline of property stock can address the issue now and prove us wrong.” Number of housing units granted planning permission Category 2017 Q1 (year to) 2018 Q1 (year to) 2019 Q1 (year to) 2020 Q1 (year to) 2021 Q1 (year to) ENGLAND – rolling annual total 329,000 314,000 327,000 315,000 294,900 % change vs previous year 22% -4.6% 4.1% -3.7% -6.4% Source Gov.uk – Planning Applications in England             Table shows the number of housing units granted planning permission that are estimated to reach the market with snagging issues Region Planning permissions granted % proportion of England total Est number to be delivered with snags Current Average house price Total value of houses with snags London 52,300 18% 51,254 £525,927 £26,955,881,945 South East 43,200 15% 42,336 £420,199 £17,789,525,656 North West 40,400 14% 39,592 £262,731 £10,402,042,509 East of England 35,500 12% 34,790 £404,852 £14,084,803,846 East Midlands 31,000 11% 30,380 £302,701 £9,196,058,911 West Midlands region 29,900 10% 29,302 £305,790 £8,960,264,736 South West 27,100 9% 26,558 £348,888 £9,265,763,685 Yorkshire and the Humber 22,700 8% 22,246 £243,791 £5,423,383,062 North East 12,100 4% 11,858 £217,985 £2,584,870,008 National Parks 700 0% 686 N/A N/A England 294,900 100% 289,002 £348,298 £100,658,891,685 Sources Gov.uk – Planning Applications in England Home Builders Federation Gov.uk – UK house Price Index            

Read More »

Where can you still buy a new build for less than the £250,000 stamp duty holiday threshold?

The latest research from Warwick Estates has revealed which pockets of the national new build market still offer homebuyers the opportunity of a stamp duty saving right up until the final September deadline. While the initial stamp duty holiday for homes valued up to £500,000 has now passed, homebuyers purchasing up to the sum of £250,000 will still pay no stamp duty right up until the end of September. However, it’s no secret that the new build market carries a property price premium compared to existing homes. In fact, the average new build house price is currently £348,298 in England, 30% higher than the average price for an existing property. This would suggest that the average new build homebuyer may find it tricky to find a property that sits below the current and final stamp duty holiday threshold and at a regional level this may be the case.  Just two regions are currently home to an average new build house price below £250,000, the North East (£217,985) and Yorkshire and the Humber (243,791). However, when analysing the market at local authority level, Warwick Estates found that there is still some hope. In fact, 23% of local authority districts in England are home to a new build average house price that still sits below £250,000. You can see the full table below but the list includes areas from all over England including Northumberland, Plymouth, Great Yarmouth, Manchester, Ipswich, West Devon, Lancaster, Southampton, Liverpool, Scarborough, Norwich, Nottingham, Bradford, Gateshead and Stoke. COO of Warwick Estates, Bethan Griffiths, commented: “New build homes will always attract a premium when compared to the wider market and so those looking to climb the new build ladder will always need a little more in the savings pot. However, there seems to be a common misconception that new build homes are vastly unaffordable but as the figures show, the average new build home costs less than £250,000 across nearly a quarter of all areas in England. So not only can a new build home be purchased at a relatively affordable price point, but those currently in the market for one have a good chance of still securing a stamp duty free sale.” Location Average New Build House Price England £348,298 East Midlands £302,701 East of England £404,852 London £525,927 North East £217,985 North West £262,731 South East £420,199 South West £348,888 West Midlands Region £305,790 Yorkshire and The Humber £243,791 Data sourced from the Gov.uk – UK House Price Index (New Build vs Existing). March 2021 – latest available data.     Table shows the areas of England where the current average new build house price is still below £250,000 Location Average New Build House Price Northumberland £246,397 Fenland £245,637 City of Plymouth £243,533 Great Yarmouth £241,469 Manchester £239,678 Telford and Wrekin £238,884 Ipswich £238,831 West Devon £238,777 Allerdale £238,665 Newark and Sherwood £238,329 Knowsley £237,455 Sandwell £236,847 Tameside £234,525 Tamworth £233,614 Rotherham £233,322 Wolverhampton £233,189 Lancaster £231,215 Torbay £231,043 Southampton £230,143 Salford £229,586 Kirklees £229,494 North East Lincolnshire £228,064 Eden £226,530 St Helens £225,820 Liverpool £225,450 Broxtowe £224,828 Rochdale £224,768 Erewash £224,701 Oldham £223,654 Wakefield £221,607 Scarborough £220,679 Walsall £219,680 Ashfield £219,404 South Tyneside £218,370 Norwich £217,586 Sefton £217,305 Middlesbrough £215,115 Sheffield £214,295 City of Nottingham £213,251 City of Derby £213,168 Sunderland £212,758 Bolsover £209,730 Wyre £209,356 North Lincolnshire £209,066 Carlisle £206,690 Bassetlaw £206,421 Bradford £205,342 Blackburn with Darwen £201,666 Darlington £201,116 Mansfield £200,151 Redcar and Cleveland £200,115 West Lindsey £197,991 Boston £197,314 Bolton £197,074 South Holland £194,183 Newcastle-under-Lyme £193,940 Wirral £191,211 East Lindsey £190,763 Barrow-in-Furness £190,762 City of Kingston upon Hull £189,873 Gateshead £187,368 Pendle £185,122 Doncaster £183,153 Copeland £181,950 Stoke-on-Trent £181,278 Lincoln £181,066 Barnsley £179,817 County Durham £169,866 Hartlepool £166,313 Stockton-on-Tees £163,047 Blackpool £162,375 Burnley £134,834 Hyndburn £105,888 Data sourced from the Gov.uk – UK House Price Index (New Build vs Existing). March 2021 – latest available data.    

Read More »